Research
Insight Report: Investor Exposure to Marketplace Loans Affected by Hurricane Florence
26 September 2018
This report aims to assist investors studying the potential impact of Hurricane Florence on MPL payment patterns. The report summarizes data across seven categories: outstanding loans affected, delinquency status, FICO score, loan payment to income ratio, loan coupon, and home ownership.
Following Hurricane Florence, FEMA has designated 18 counties in North Carolina as eligible for public assistance, and investors are trying to gauge the exposure of their portfolios to the areas affected. Using data from almost two million loans across four of the largest MPL platforms, with an aggregate current balance of more than $15 billion, we have been able to quantify the number of loans in the impacted region. Fortunately, only 0.4% of the principal balance outstanding is affected, significantly less than the population affected by Hurricanes Harvey and Irma in 2017 (9.1%).
Most investors can probably rest easy knowing exposure is minimal, and those that want to dig deeper can take comfort in the fact that the profile of affected borrowers is not skewed significantly towards an at-risk demographic. The FICO distributions of impacted and non-impacted borrowers are quite similar (Fig 2), and although it looks like the impacted borrowers have a higher DTI on average (Fig 3), there is less tail risk in the distribution; however, the difference in delinquency is minimal, as evidenced in Fig 6.
Finally, another slightly mitigating factor is that the homeownership rate for impacted borrowers is higher (Fig 5). A Cleveland Fed study found that debt actually goes down after a natural disaster as borrowers use flood insurance proceeds to pay down debt rather than renovate. While this applies primarily to mortgages, it is still a noteworthy observation.
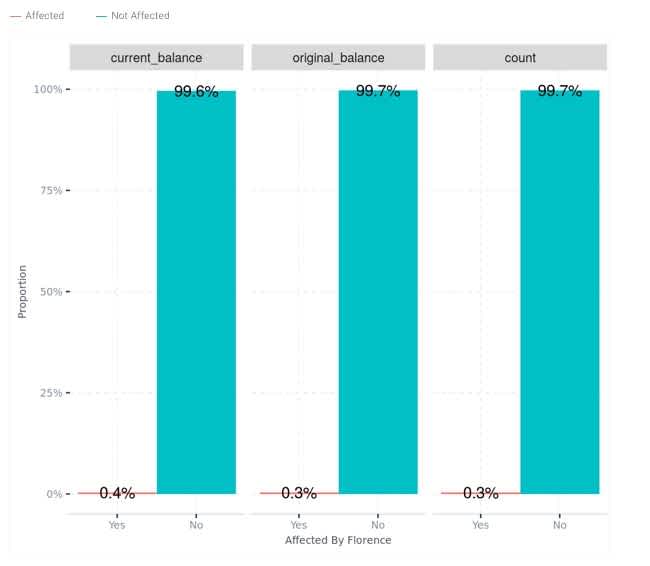
Fig 1 Proportion of loans affected by Hurricane Florence
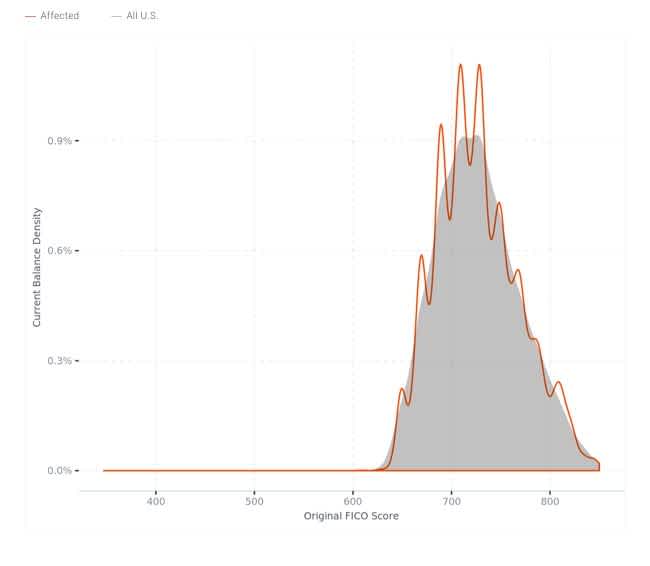
FIG 2 FICO distributions among impacted and non-impacted borrowers
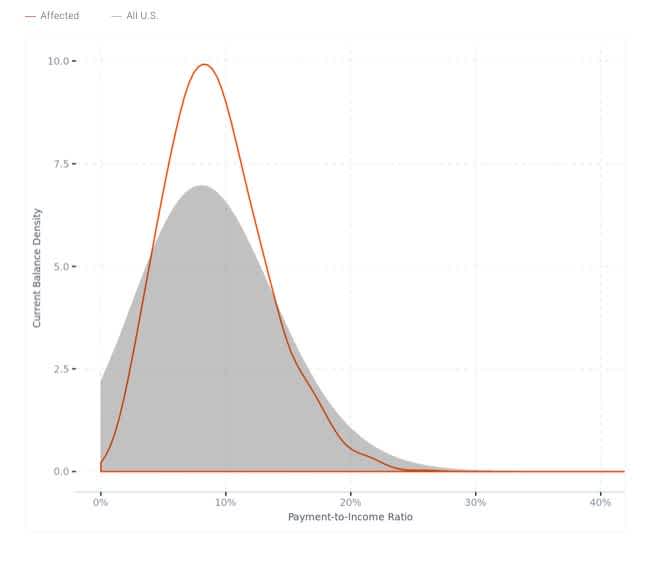
FIG 3 DTI among impacted and non-impacted borrowers
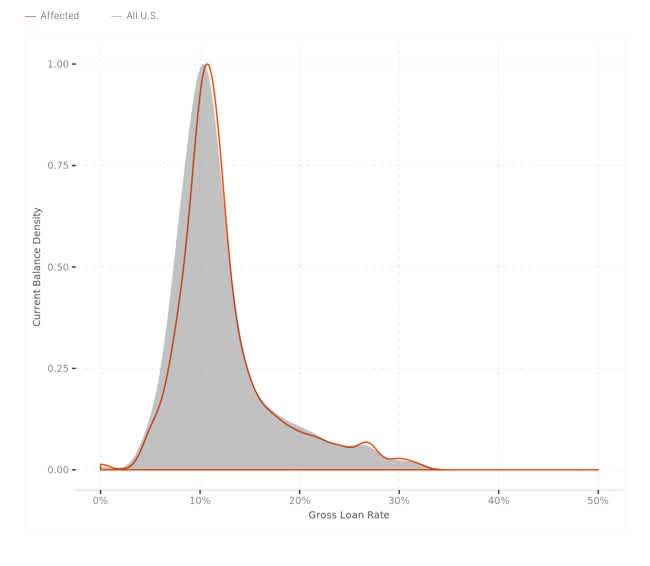
FIG 4 Gross Loan Rate Among Impacted Borrowers
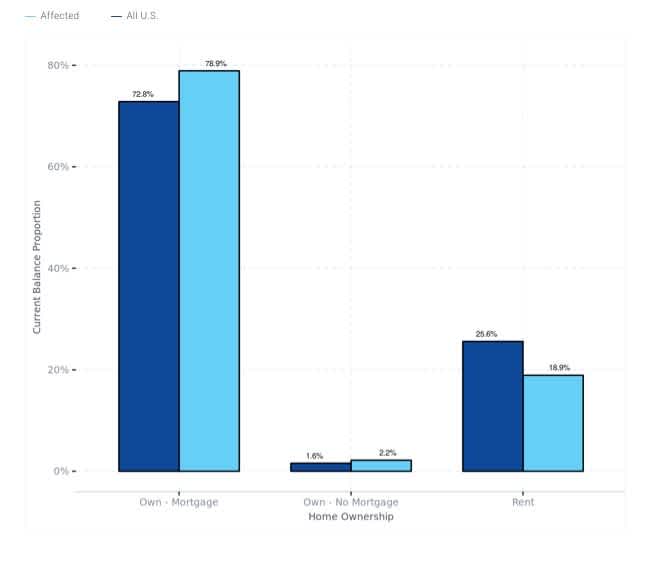
FIG 5 Ownership rates among impacted borrowers
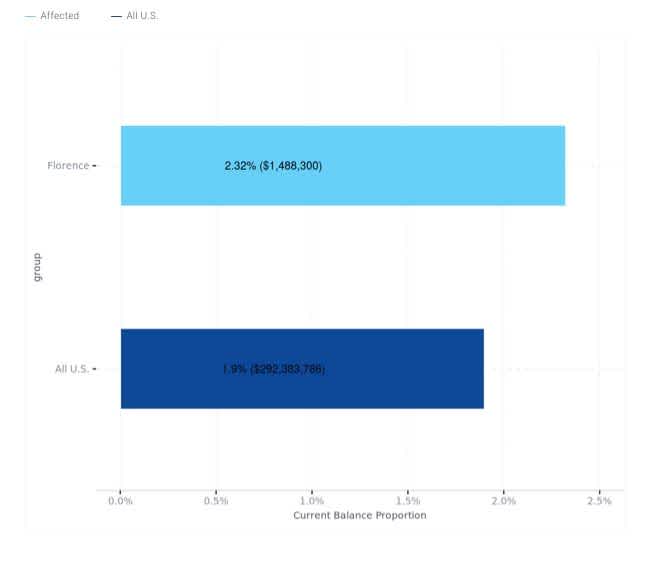
FIG 6 30+ Delinquency rates among impacted borrowers
Report Credits:
Scott Chen Data Analyst, Infrastructure
Jonathan Braus Principal Credit Analyst
Simon Proudfoot Data Analyst, Solutions
Lindsey Boyer Product Designer
RELATED POSTS

Performance Report: Consumer Unsecured, November 2025
17 December 2025
