Research
Insight Report: Monthly Performance Overview—November 2019
14 November 2019
Preface
All performance data comes from aggregated information from securitization deals available on dv01app.com.
All performance is presented based on the Collateral Cut-off Date for each reporting period, not the Remittance Reporting Date.
All performance metrics for each asset type are aggregated from only publicly issued securitizations within that asset type.
The Issuance Period represents an aggregation of all securitizations with a Closing Date that is within each period.
Subsequently, the report is compiled as of the issuance period of each asset class, rather than as of the origination period.
All metrics are weighted averages of all securitizations in each asset type, weighted by the Outstanding Balance of each securitization at each reporting date.
Similarly, the Issuer-level information available in the appendix is a weighted average of all public securitizations in the corresponding asset type and issuer.
No Portfolio or Platform-level information has been used to compile any of the performance metrics or derive any of the conclusions in this report.
Additional Notes on Performance Dating
Data is aggregated by Issuance Periods (half-year), where a half-year is comprised of 6 periods (6 months) of reporting.
At the time of securitization, all deals are substantially current, with little to no delinquencies in the first reporting period.
Likewise, there is effectively 0 (zero) CDR for the first 3-4 months of a securitization in the MPL world (and longer for CRT).
dv01 believes presenting the first 6 months of each Issuance Period shows misleading curves for delinquency and CDR, which are also inconsistent between Issuance Periods depending on intra-period volumes.
Therefore, in order to more accurately represent performance curves, this report only displays performance starting from month 7 of each Issuance Period. In so doing, dv01 notes specifically that the first point for each issuance period is not the first possible reporting period.
Additionally, the delinquency and CDR at the first reporting period are not 0 (zero) as one would expect, given that securitizations are issued with without seriously delinquent loans.
Regarding CRT
Given the longer performance history of mortgages, we aggregate by 6-month issuance periods but display data based on yearly issuance.
Subsequently, the first 6 months of performance reporting for each Issuance Period only represents performance from securities issued in the first half of the year.
CRT Performance
Prepayment Rates (CPR)
Prepayment rates (CPR) increased again in August as further rate moves continue to drive higher prepayment.
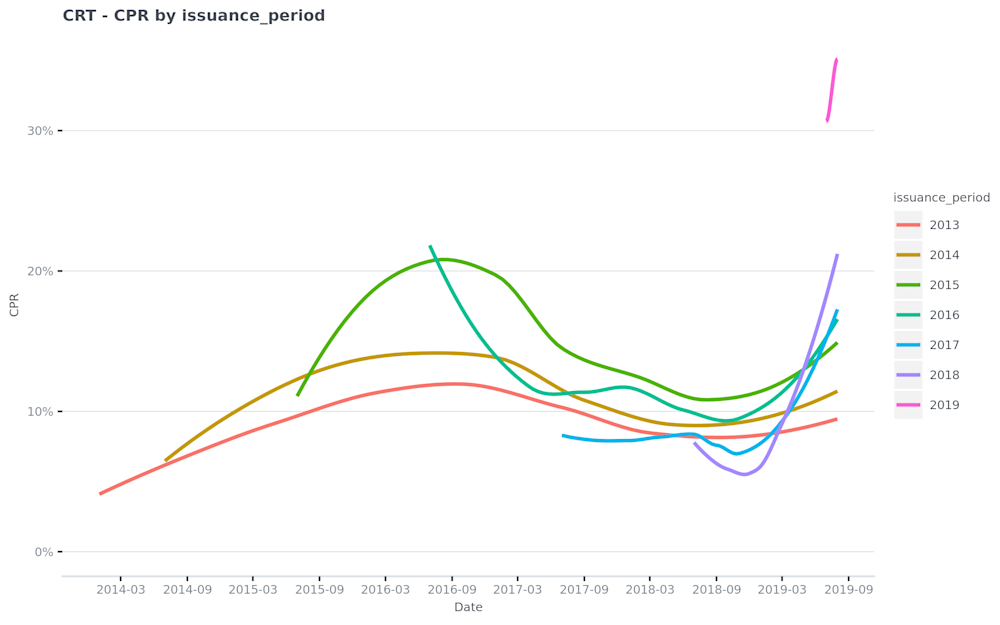
CPR rates are highest overall for the 2019 issuance period - for which we display limited data due to the dating limitations mentioned in the disclaimer.
The highest CPR increases were concentrated in the 2018 issuance period loans where CPRs are above 20 from mid single digits and 2017 which went from mid/high single digits to close to 20.
Older issuance periods had muted gains, as expected due to lower WAC on more seasoned loans.
CPR is a lagging indicator as this indicates loans that started refinancing in June and does not yet reflect the full impact of rate moves.
2018 prepayment rates are approaching the CRT peak rates of 2015 loans in the rate rally from 2016.
dv01 believes 2018 CPRs should eclipse 2016 peaks as prepayments start to come in due to the rate moves since August.
Delinquency (DQ) and Default (CDR) Overview
Delinquency rates have continued to flatten out for seasoned issuance periods.
DQs have risen for newer issuance periods, in line with normal seasoning expectations.
On the flip side of lower CDRs, loans stay delinquent longer in the Actual-Loss deals, hence the DQ rates at any given period are higher in Actual-Loss deals.
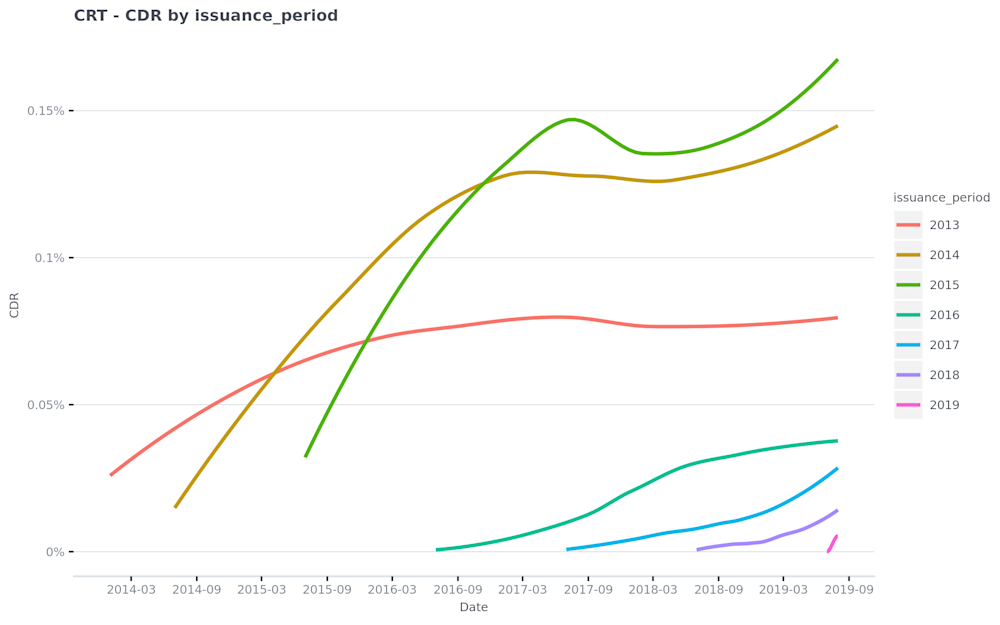
Therefore, higher DQ rates are not a clear indicator of performance between Fixed-Loss and Actual-Loss issuance periods, but rather a function of deal type. Default (CDR) rates remain muted, particularly for actual loss deals (issuance period 2015 and later) where CDR rates are sub 0.05%.
CDRs are significantly lower in 2016 and onward issuance periods because of the shift from Fixed-Loss securitizations to Actual-Loss securitizations.
Fixed-Loss sets a “fixed” loss severity for each loan, and specifies a period when the loan recognized as defaulted (and goes into the CDR calculation).
Actual-Loss recognizes the actual losses borne on a particular loan, and only recognizes a defaulted loan when all liquidation, foreclosure, deed-in-lieu, or short sale procedures are completed.
Therefore, lower CDRs are not a clear indicator of performance between Fixed-Loss and Actual-Loss issuance periods but rather a function of deal type.
All MPL Sector Performance
Prepayment Rates (CPR)
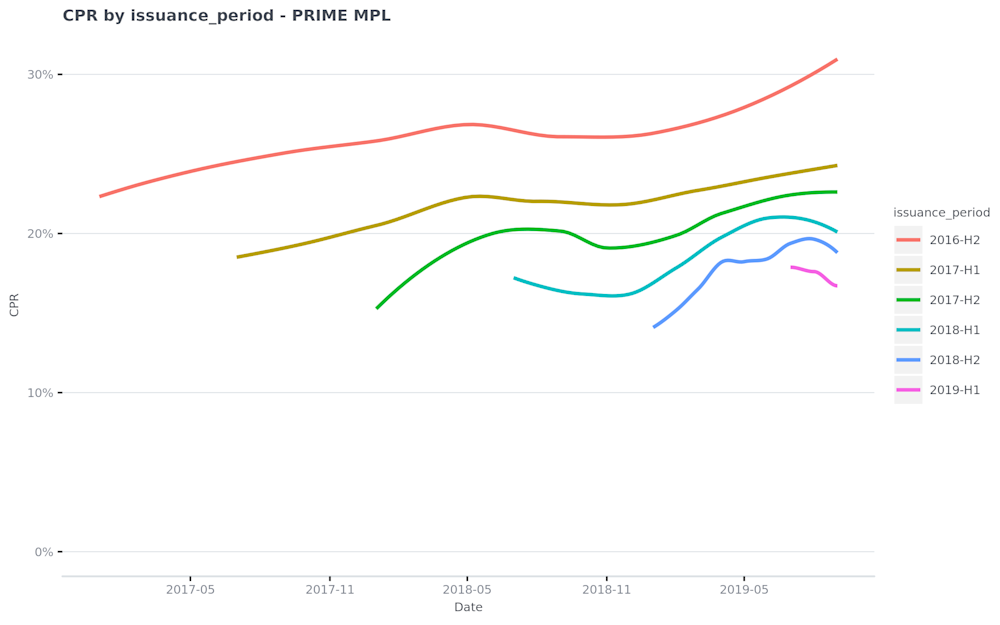
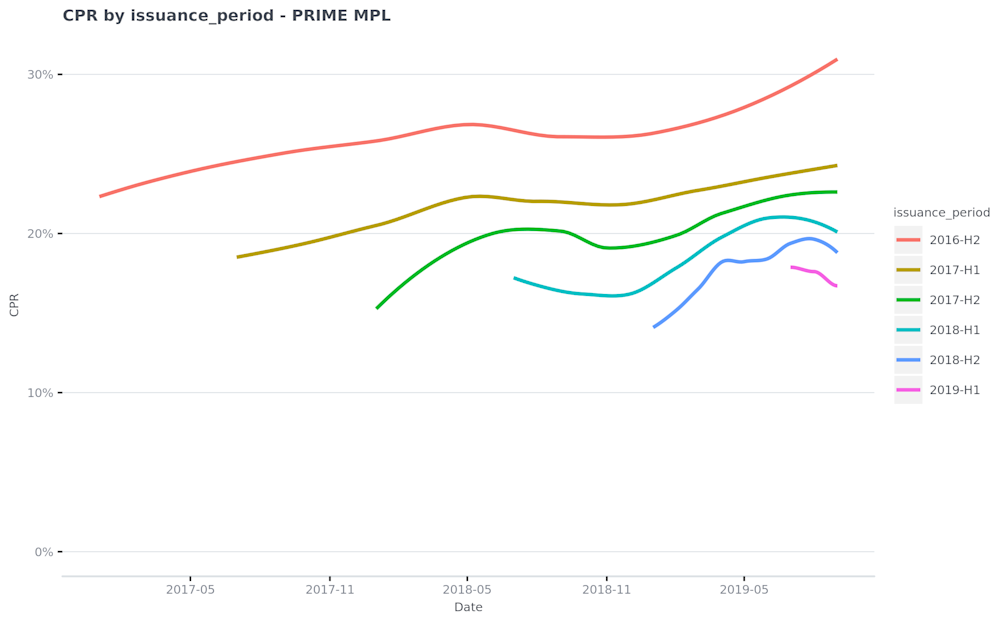
Prime & Super Prime MPL
Prepayment speeds continue to rise across issuance periods as loans season.
Prepayment speeds are higher on more seasoned issuance periods due to the lower number of loans outstanding in pre-2017 securitizations.
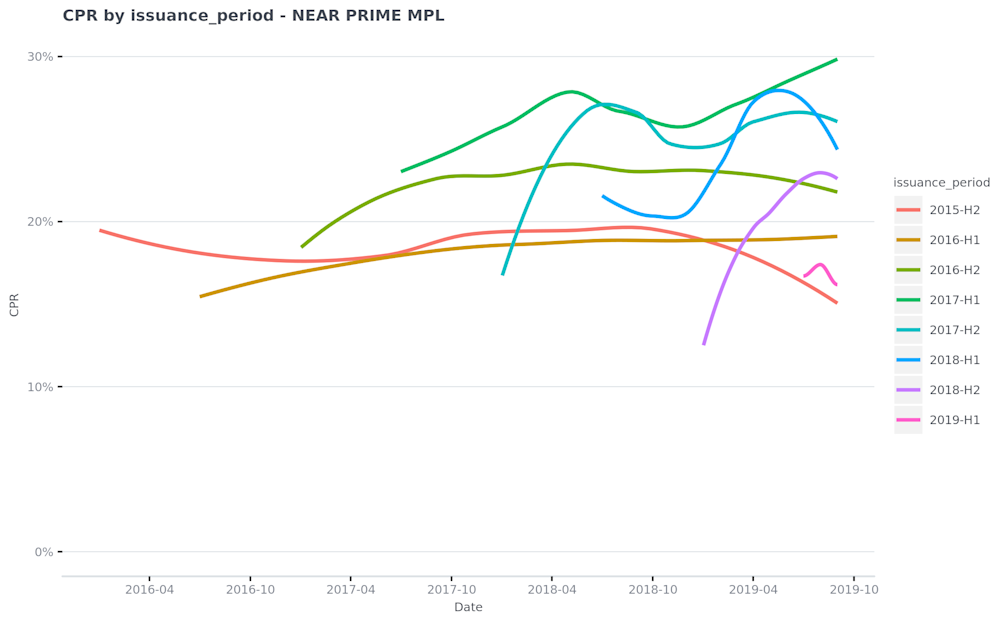
Near Prime MPL
Near-term prepayment speeds are varied, but there’s been a sustained increase in 2017 prepay speeds as loans have seasoned.
Prepayment speeds for 2017 and 2018 issuance periods are clearly higher than pre-2017 issuance periods.
All MPL Sector Performance
Delinquency (DQ) Rates
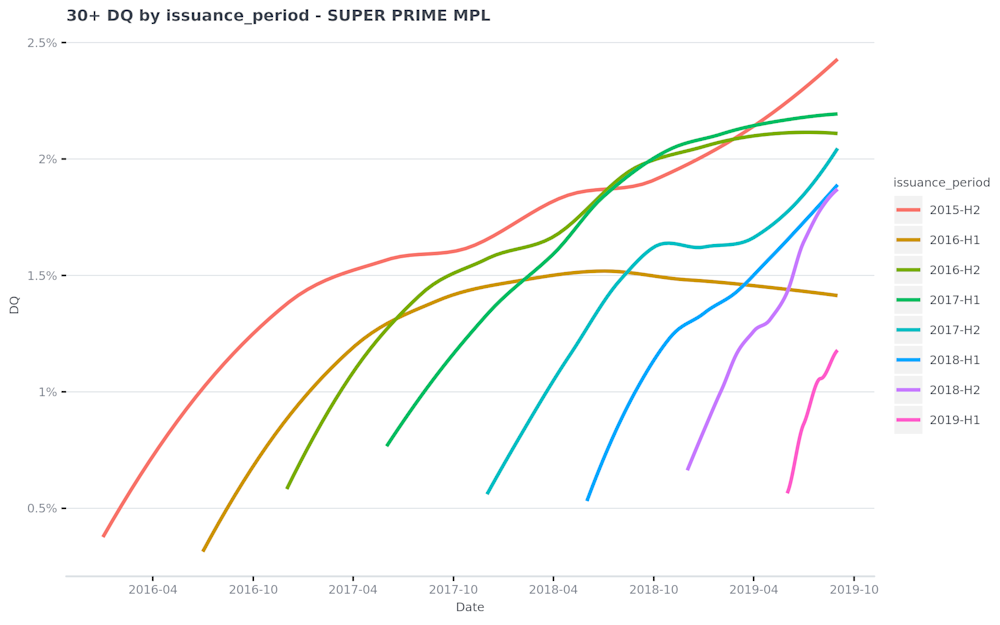
Super Prime MPL
DQs have continued to flatten out for seasoned issuance periods prior to 2017-H2
There has been an increase in delinquencies in 2017-H2 in the past few months after a period of flattening, similar to trends observed in other MPL sectors.
Overall levels are still in line with historical trends.
2018 delinquency trends are covered in more detail in the “Additional Note on Delinquency and CDR” section.
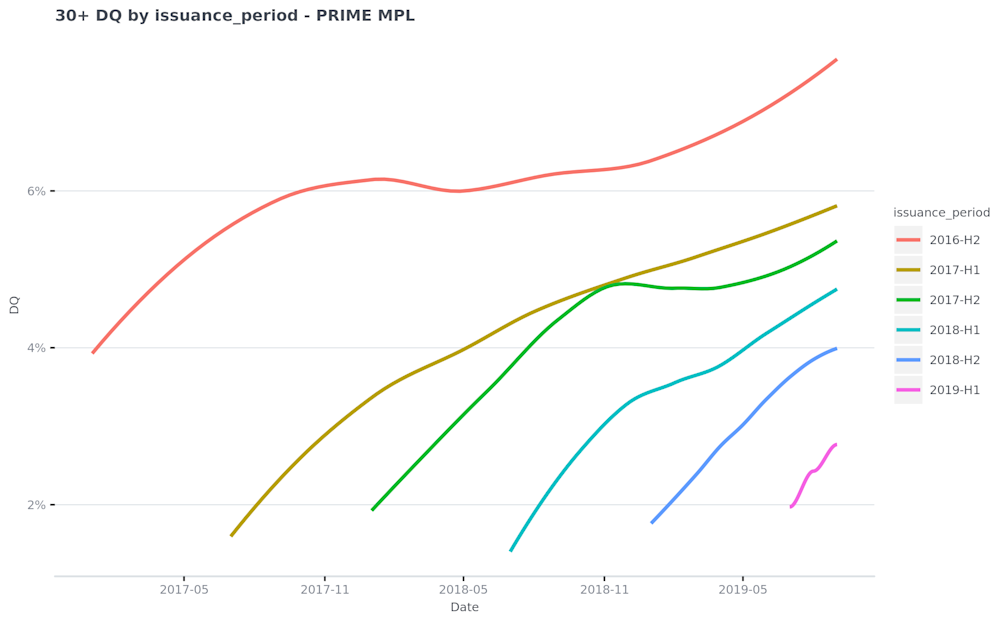
Prime MPL
DQs and CDRs have come down significantly from the first issuance period, 2016-H2.
Overall level of delinquencies in 2018 issuance have been substantially lower than pre-2018 issuance periods.
Delinquencies are still rising but the trend suggests they will peak below prior issuance periods.
This is covered further in the “Additional Note on Delinquency and CDR” section.
The slope of the delinquency curves have been consistent for post 2016 issuance periods.
There has been some acceleration in 2017-H2 DQ rates over the past few months after a period of flattening, but total levels are still largely in line with historical trends.
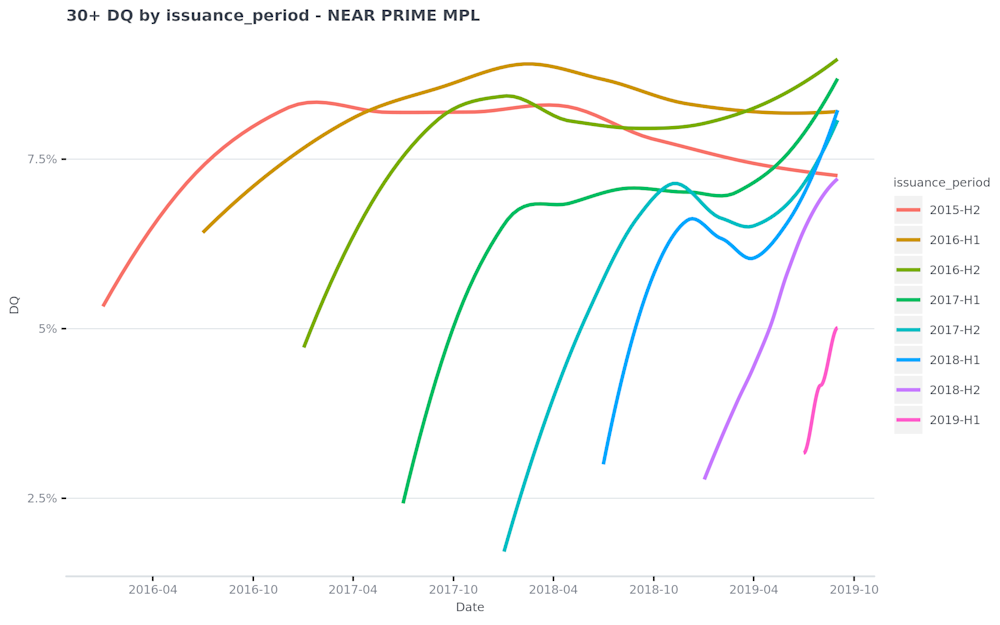
Near Prime MPL
There has been a continued increase in DQ rates over the past few months in the 2017 and 2018 issuance periods.
The pickup suggests that we have not yet hit a peak of CDRs for the 2017 and 2018-H1 issuance periods, despite the flat shape of the CDR curve.
Overall delinquency levels are within prior period performance trends, though dv01 will continue to monitor the increases.
The collateral has factored down more substantially than pre-2017 issuance, indicating the higher DQs and CDRs are occurring on a smaller portion of the original balance.
All MPL Sector Performance
Default (CDR) Rates
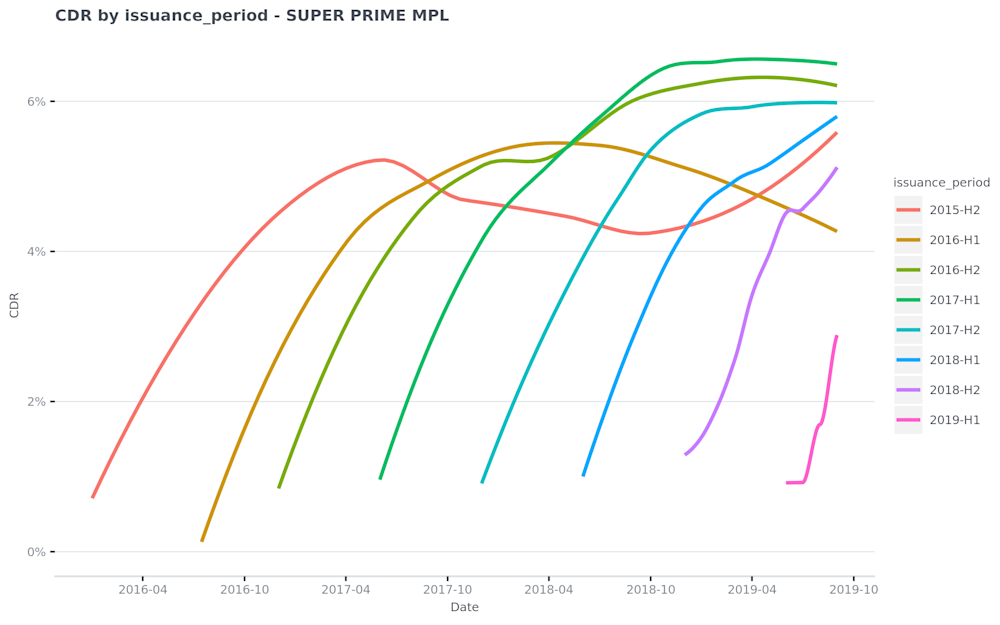
Super Prime MPL
CDRs have decelerated for several months in 2016 and 2017 issuance periods.
dv01 expects further increases future CDR as a result of the aforementioned increases in delinquencies for 2017-H2 and later issuance periods.
There has been deceleration in the 2018-H1 issuance period in recent months but based on delinquency trends we expect that to reverse.
However, the trajectory shows the performance will be consistent with seasoned issuance periods.
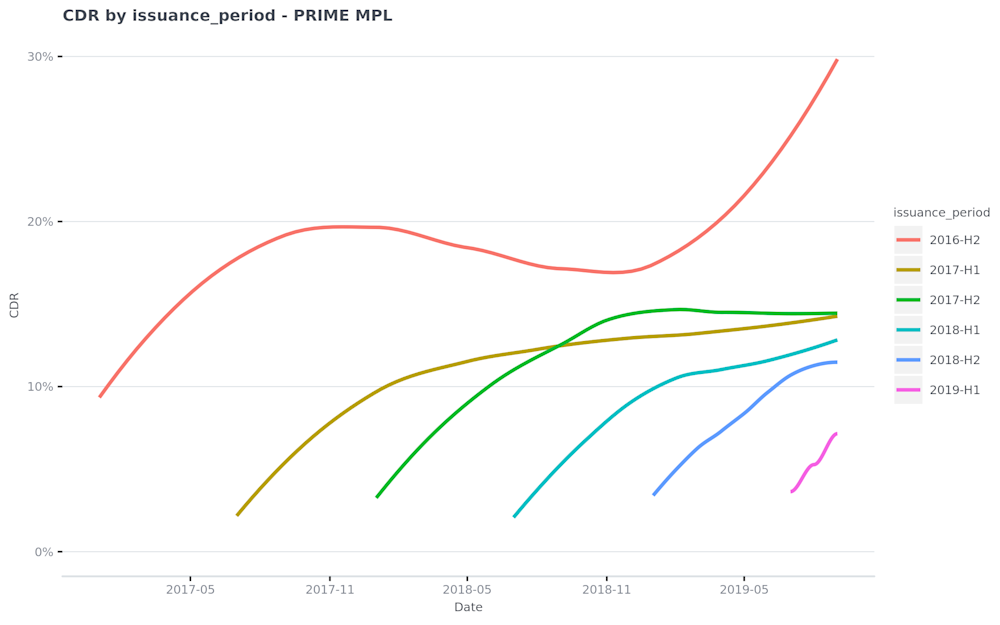
Prime MPL
DQ rates and CDRs have come down significantly from the first issuance period, 2016-H2.
Similar to delinquency, overall CDRs have been lower for 2018 issuance than prior issuance periods.
Similar to delinquency, CDR are still rising and have not hit peak yet, but the current CDR and delinquency trend suggest CDRs will remain lower than prior issuance periods.
This is covered further in the “Additional Note on Delinquency and CDR” section.
CDRs have plateaued for 2017 and 2018-H1 issuance periods in recent months.
CDRs for have plateaued at similar levels for all post 2017 issuance periods, and delinquency trends do not indicate significant acceleration to come.
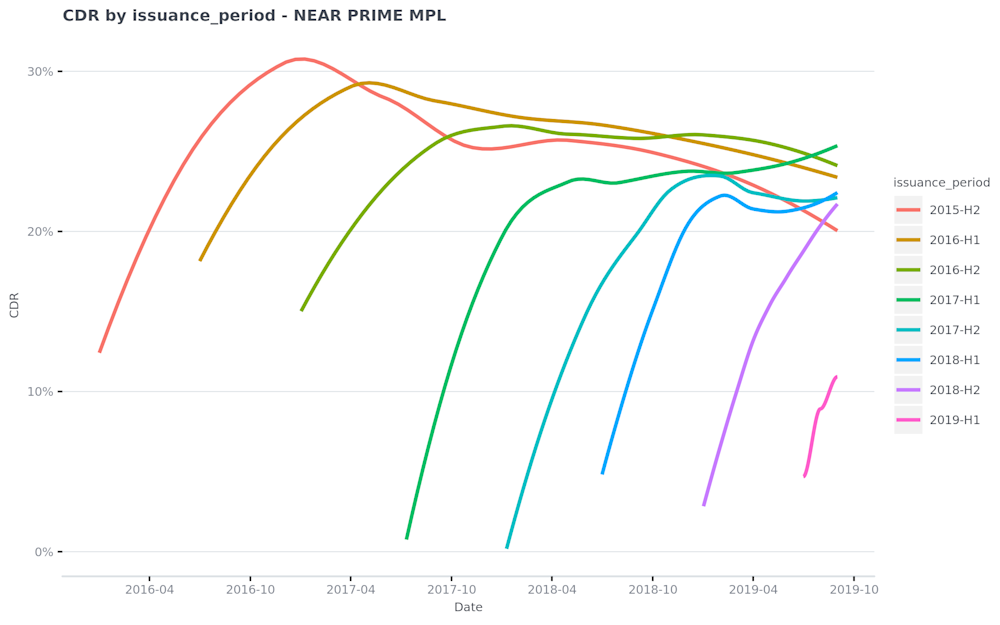
Near Prime MPL
Thus far, 2017 issuance CDR have peaked below pre-2017 issues.
Due to the higher recent DQ rate mentioned earlier, dv01 expects CDRs to increase in the near-term.
Nevertheless, current CDRs on 2017-H2 and 2018 issuance periods are still several percent lower than peaks seen in pre-2017 issuance periods.
2018-H1 CDRs have begun to rise as a result of the higher DQ rates noted above, but are largely still in line with 2017 trends.
All MPL Sector Performance
Additional Notes on Delinquency and CDR in Prime and Super Prime MPL
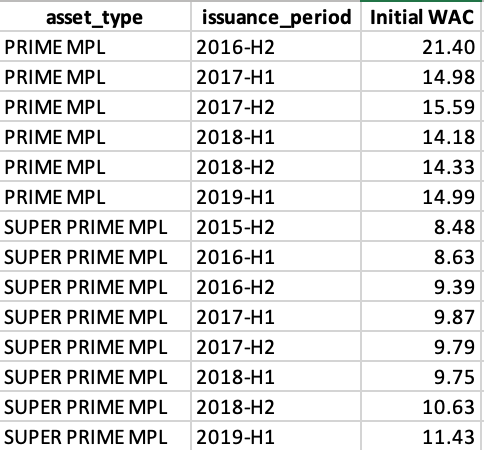
In Super Prime MPL, 2017 & 2018 DQ rates and CDRs are reaching higher levels than 2015 and 2016.
In Prime MPL, as mentioned earlier, DQ rates and CDRs have been lower than prior issuance.
There is a difference with the slope of the 2019 issuance period versus prior periods.
These trends are explained by the increasing weighted average coupon (WAC) of loans being securitized.
Super Prime MPL:
WACs have gone from around 8.5% in 2015 and 2016-H1 to around 9.8% for 2017 issuance, to 10.6% in 2018-H2 and 11.4% in 2019-H1.
Prime MPL
2016-H2 WACs were significantly elevated at 21%, which explains the significantly higher CDR and delinquency trends for that issuance period.
Post-2016, WAC decreased to 15% and 15.5% respectively in 2017, and ~14.25% in 2018, which explains the lower delinquency and CDR for 2018 issuance.
Since 2018, WAC has rebounded back to 15%, which explains the difference in slope of the 2019 issuance period.
GWAC trends are inconsistent in Near Prime MPL due to the introduction of a separate Rate Administration Fee independent of loan WAC.
Issuance Report
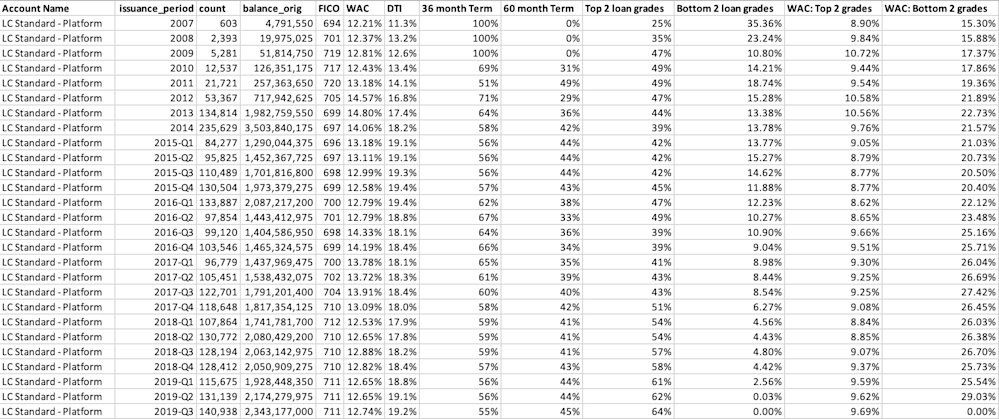
Lending Club Quarterly Issuance Overview
LendingClub formally reported their 3nd quarter 2019 issuance information.
Total issuance was $2.34 Billion, an increase of 13.6% Y/Y and 7.8% Q/Q.
For the second straight quarter, they have 0 (zero) issuance in E, F and G grades.
Gross Wac was 12.74% - driven by higher percentage of issuance in high-grade loans.
Weighted Average WACs for the top 2 grades was 9.69%, up 7bp Q/Q.
On a Y/Y basis, Average WACs for the top 2 grades are up 62bps, and are at all-time highs.
All MPL Sector Performance
Securitization Issuance Overview
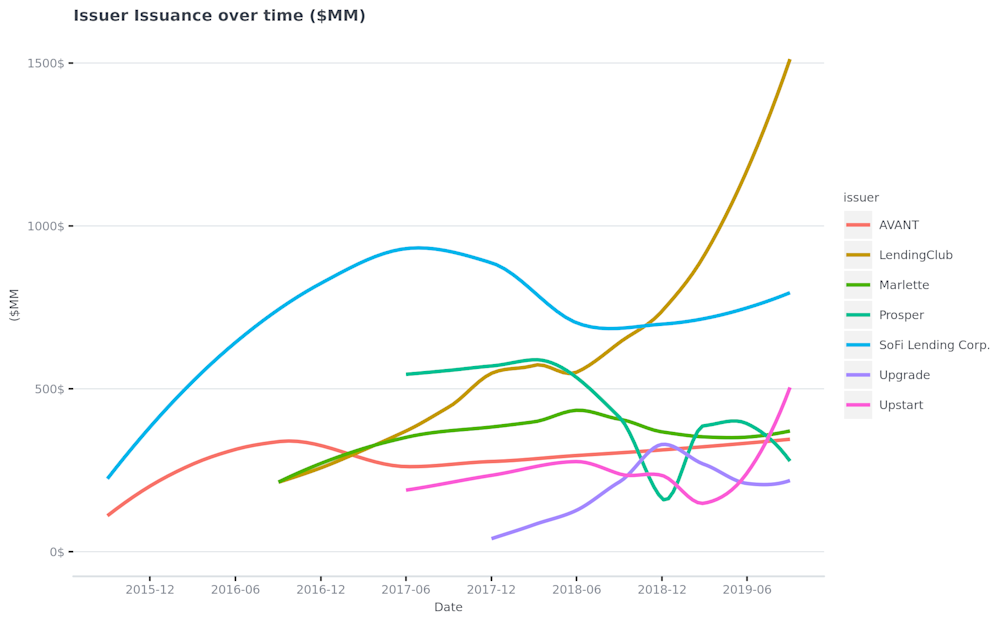
The issuance of certificates (such as CLUBC, PPTT, and other certificates issued directly by marketplace originators) exceeded $1BB for the first time in the 3rd quarter of 2019.
$1.5 BB of pass-through certificates were issued, an increase of 98% Q/Q, 136% Y/Y and up from $65mm in Q4 of 2017, the first quarter certificate issuance.
Traditional bond issuance was $2.3BB, up 9% Y/Y but down 11% Q/Q, largely due to the significant shift to Certificate issuance.
Total securitization volume (certificate and traditional bond issuance combined) was a record $3.81 BB, up 15% Q/Q and 39% Y/Y.
LendingClub is the largest certificate issuer, accounting for 79% of total certificate issuance.
LendingClub was the first to issue certificates, but other issuers have followed suit.
Total securitization volume hit record highs for Avant, LendingClub, and Upstart.
Prosper and SoFi had decreased issuance volume Q/Q largely due to their record issuance quarters occurring in 2019-Q2.
Overall, securitizations, particularly of issuer certificates, continues to play a significant, and growing part of the Marketplace universe.

Appendix
Near Prime & Super Prime Securitization Performance, Aggregated by Issuer
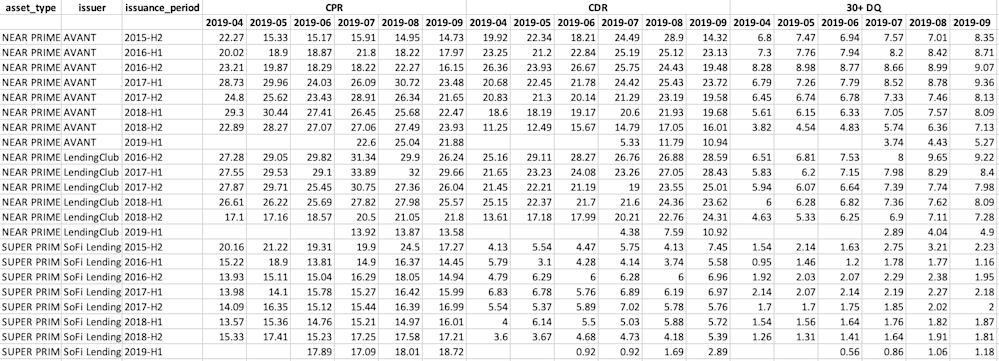
Prime MPL by Securitization Performance, Aggregated by Issuer
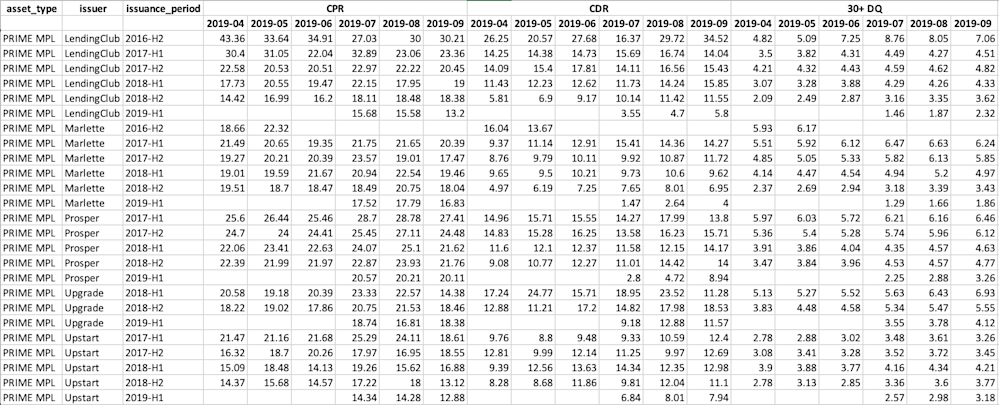
CRT by Securitization Performance, Aggregated by Issuer

Disclaimer
This publication is intended as a general overview and discussion. It does not constitute an offer to sell or a solicitation of an offer to buy any security.
dv01 does not make an effort to differentiate or opine on specific issuers or issuer performance trends within a specific sector.
dv01 also does not seek to influence future performance or opine on the investment returns of any particular investment strategy.
Investors should consider this publication as only a single factor in making their investment decision.
Past performance is not a guarantee of future performance.
All opinions, projections, and estimates constitute the judgment of the author as of the date of publication and are subject to change without notice.
No material, non-public information was used to derive the findings and analysis of this report.
dv01 has established policies and procedures to maintain the confidentiality of certain nonpublic information received in the course of its business operations.
The only platform-level information present in this report was in the insights into Lending Club’s quarterly origination information, which only references the publicly disclosed platform information that LendingClub makes available. A summary of the referenced information can be found here: https://www.lendingclub.com/info/demand-and-credit-profile.action
All performance data comes from aggregate information from securitization deals available on dv01app.com.
All performance is presented based on the Collateral Cut-off Date, not the Remittance Reporting Date.
Issuer-level information available in the appendix was similarly aggregated from securitization deals in which the issuer’s loans comprise the underlying collateral.
This publication has been prepared independently of any issuer of securities mentioned herein. In no instance is this report being published in connection with any proposed offering of securities or as an agent of any issuer of any securities.
dv01 does not have any authority whatsoever to make any representation or warranty on behalf of an issuer.
dv01 does and seeks to do business with companies covered in this research reports. As a result, investors should be aware that the dv01 may have a conflict of interest that could affect the objectivity of this report. However, readers should also note that dv01 has in place organizational and administrative arrangements to manage potential conflicts of interest of this nature.
No part of the author’s compensation was, is, or will be, directly or indirectly, related to the specific recommendations or views expressed by that research analyst in this report.
While dv01 has obtained information from sources it believes to be reliable, dv01 undertakes no duty of due diligence or independent verification of any information it receives.
dv01 does not accept any liability whatsoever for any direct, indirect or consequential damages or losses arising from any use of this information including out of actions taken or not taken on this basis of this publication.
dv01 assumes no obligation to make any updates following publication in any form or format.
Report Credits: Vadim Verkhoglyad, CFA, Senior Product Specialist
RELATED POSTS

Performance Report: Consumer Unsecured, November 2025
17 December 2025
